· H2 Mathematics — Ten-Year Series, worked ← All 10 questions

2016 A-Level · Paper 2 · Question 8

2016 H2 Maths Paper 2, Question 8

Correlation and regression 11 marks regression lines
Download Paper 2 solutions (PDF)

Part (i)

2 marks
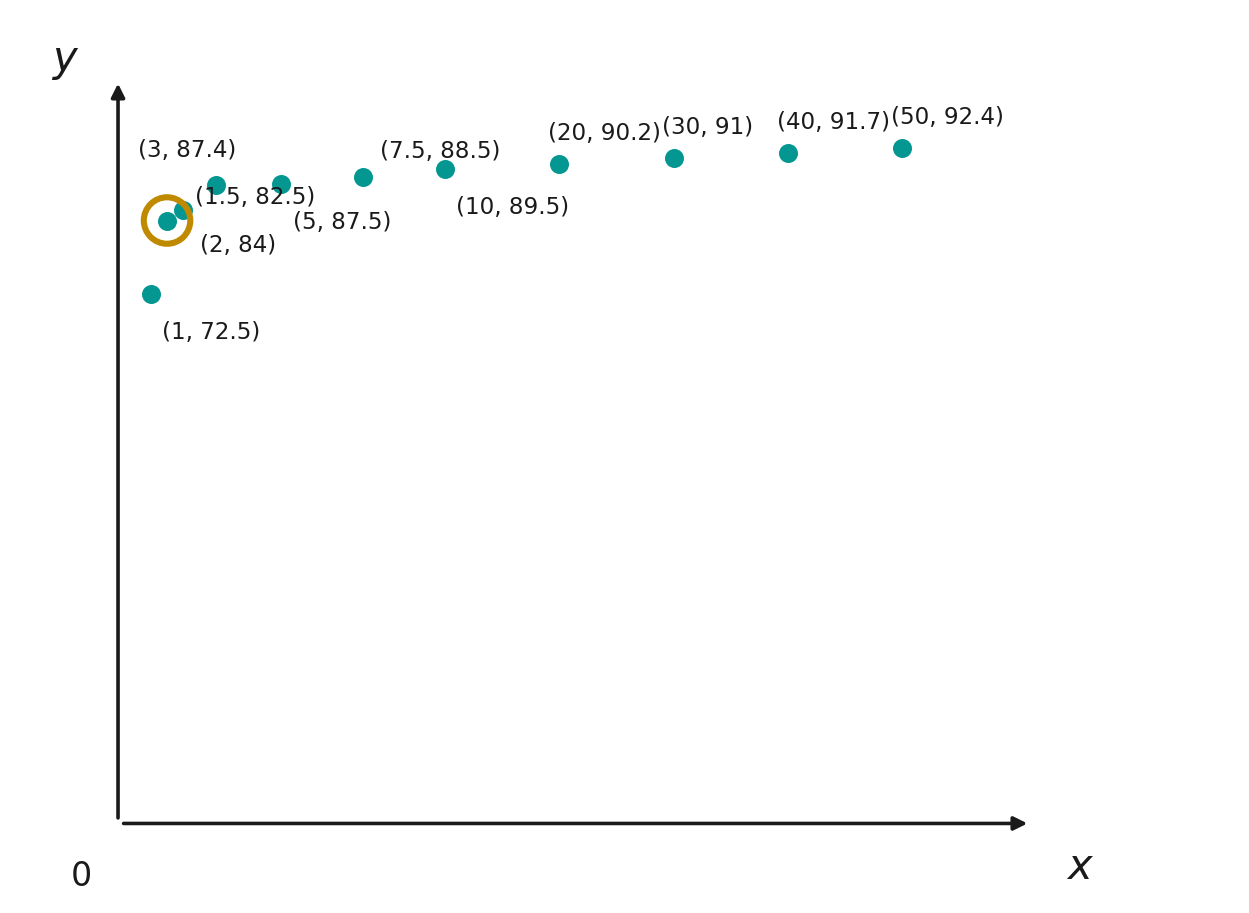
Sketch for question 8

The circled point is (1.5, 82.5)(1.5,\ 82.5), which breaks the otherwise smooth increasing pattern of the data.

Part (ii)

1 mark

Explanation: the scatter diagram shows the points rising steeply at first and then levelling off towards a roughly horizontal spread as xx increases, i.e. the relationship is curved (concave), not a straight line. A model y=ax+by = ax + b would give a constant rate of increase in yy for a fixed increase in xx, which does not match the way the points bend over for large xx.

Part (iii)

5 marks

Since yy increases as xx increases (efficiency rises with power), we need dydx>0\frac{dy}{dx} > 0.

y=cx+dy = \frac{c}{x} + d
dydx=−cx2\frac{dy}{dx} = - \frac{c}{x^{2}}

For dydx>0\frac{dy}{dx} > 0 we need −c>0- c > 0, i.e. c<0c < 0.

As x→∞x \rightarrow \infty, cx→0\frac{c}{x} \rightarrow 0, so y→dy \rightarrow d. Since the efficiency values level off at a positive percentage (around 90%90\%–92%92\%) rather than at 00 or below, d>0d > 0.

∴ c<0\therefore\ c < 0 and d>0d > 0.

Part (iv)

3 marks

Approach

the model y=cx+dy = \frac{c}{x} + d is linear in u=1xu = \frac{1}{x}, so we let u=1xu = \frac{1}{x} and regress yy on uu, excluding the point (1.5, 82.5)(1.5,\ 82.5) identified in part (i).

Let u=1xu = \frac{1}{x}. Excluding x=1.5x = 1.5, the data become

xx 11 22 33 55 7.57.5 1010 2020 3030 4040 5050
uu 11 0.50.5 0.3330.333 0.20.2 0.1330.133 0.10.1 0.050.05 0.03330.0333 0.0250.025 0.020.02
yy 72.572.5 84.084.0 87.487.4 87.587.5 88.588.5 89.589.5 90.290.2 91.091.0 91.791.7 92.492.4

By GC, the regression line of yy on uu is

y=−18.5u+91.9 (by GC)y = - 18.5u + 91.9\ \text{(by GC)}

so c=−18.5c = - 18.5 and d=91.9d = 91.9, both correct to 3 s.f.

r=−0.986 (by GC)r = - 0.986\ \text{(by GC)}

∴r=−0.986\therefore r = - 0.986, c=−18.5c = - 18.5 and d=91.9d = 91.9, all correct to 3 s.f.

Part (v)

Using the model with x=1.5x = 1.5,

y=−18.51.5+91.9y = \frac{- 18.5}{1.5} + 91.9
=79.6 (3 s.f.)= 79.6\ \text{(3 s.f.)}

∴\therefore the estimated efficiency value that Xian copied wrongly is 79.6%79.6\%.

Explanation: this estimate is expected to be reliable for two reasons. First, x=1.5x = 1.5 lies within the range of xx-values (1≤x≤501 \leq x \leq 50) used to obtain the model, so this is interpolation, not extrapolation. Second, the value of r=−0.986r = - 0.986 found in part (iv) is very close to −1- 1, showing that yy and u=1xu = \frac{1}{x} are very strongly (linearly) correlated, so the model fits the remaining data closely.

This is how we mark, and how we teach.

Every Ten-Year Series question, worked in full, with the reasoning written out and the traps named.

Find out more