 The Learning Cave
Part (i)(a)
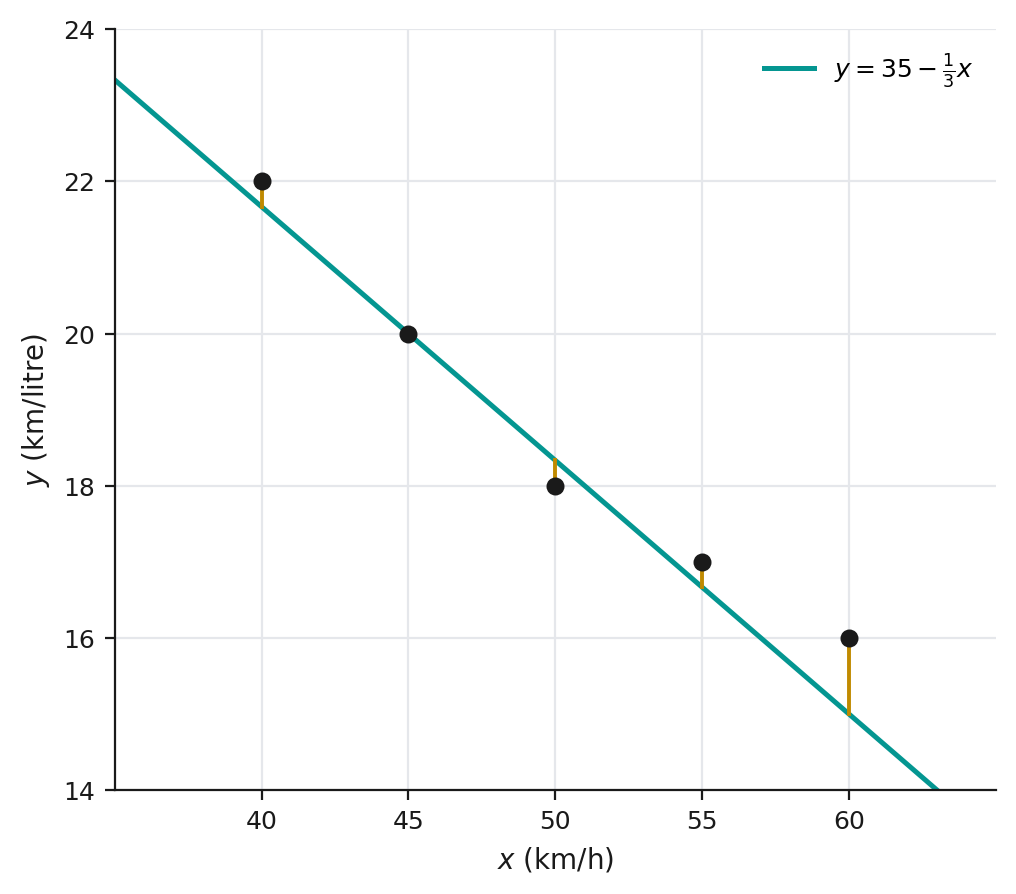
2 marksThe five data points and Abi’s line are plotted below.
Part (i)(b)
1 markFor each point, the vertical segment down to (or up to) the line is the residual for that point, also shown on the diagram.
Part (i)(c)
1 markFor each , the value predicted by Abi’s line is , and each residual is .
| 40 | 45 | 50 | 55 | 60 | |
|---|---|---|---|---|---|
Sum of the squares of the residuals:
the sum of the squares of the residuals for Abi’s line is .
Part (i)(d)
1 markExplanation: Residuals above the line are positive and residuals below the line are negative, so in the sum of the residuals these can cancel out, giving a small (or even zero) total even when individual points lie far from the line. Squaring first removes the signs, so the sum of squares only shrinks when every point genuinely lies close to the line, making it a meaningful measure of the overall goodness of fit.
Part (ii)
1 markSince Bhani’s sum of squares of residuals, , is less than Abi’s, , Bhani’s line gives a better fit to the data.
Part (iii)
1 markthe least squares regression line must pass through .
Explanation: Here and , so the line passes through .
Part (iv)
3 marksBy GC, the equation of the least squares regression line of on is
The product moment correlation coefficient is
Part (v)
2 marksUsing the regression line, at ,
the estimated fuel consumption at a speed of is .
Explanation: This value is not expected to be reliable, since lies outside the range of the given data (), so the estimate requires extrapolation, and there is no evidence that the linear model still holds at that speed.
Part (vi)
1 markall of Cerie’s data points lie exactly on her regression line, i.e. the points are perfectly collinear.
Explanation: A sum of squares of residuals of means every residual is , so every data point lies exactly on the line.