 The Learning Cave
Part (a)
2 marksSince is increasing on , as shown in the given sketch, using the value at the left endpoint of each strip as the rectangle’s height gives a rectangle that lies entirely below the curve throughout that strip — the curve only gets higher moving right within the strip. So the total area of these rectangles is less than the area of :
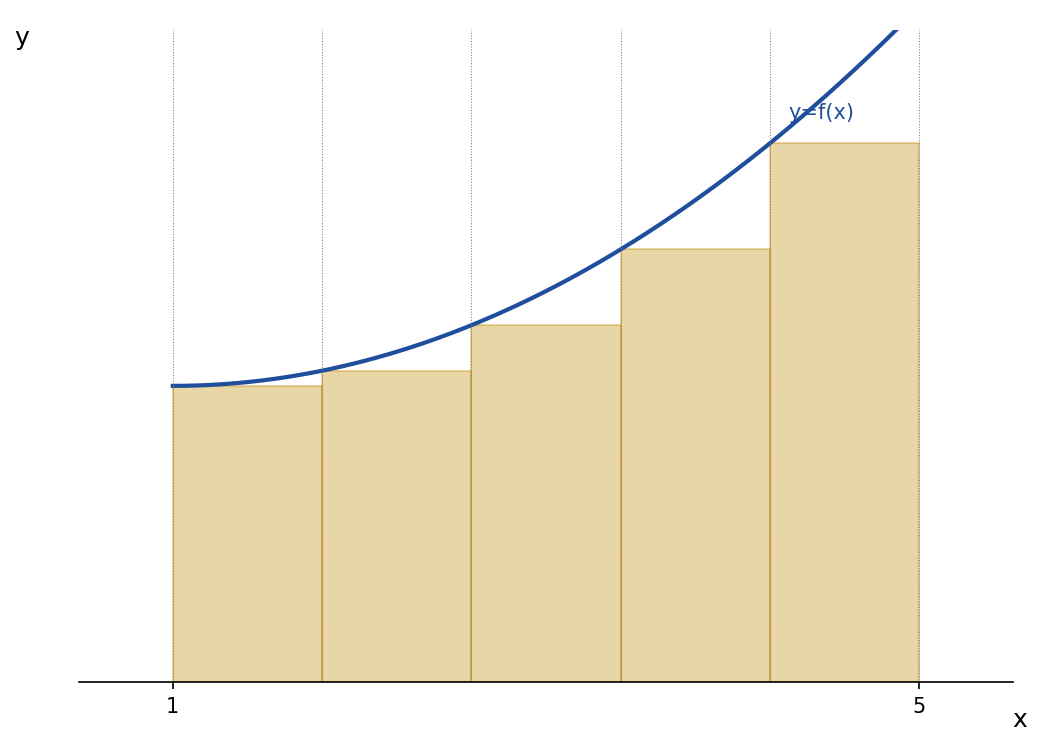
and .
Part (b)
3 marksUsing the value at the right endpoint of each strip instead gives a rectangle that lies entirely above the curve throughout that strip, since is increasing and the right endpoint gives the largest value of in the strip. So this total is greater than the area of :
.
Part (c)
With and , the strip boundaries are .
Lower bound, using the left-endpoint sum from part (a):
Upper bound, using the right-endpoint sum from part (b):
| To check your answer: the exact area, , lies between the lower bound and the upper bound , as it must ✓ |
, i.e. .
Part (d)
1 markFor the area under to be less than the left-endpoint sum , that sum must overestimate the true area. This happens when is decreasing on : the left endpoint of each strip then gives the largest value of within that strip, so each rectangle lies entirely above the curve.
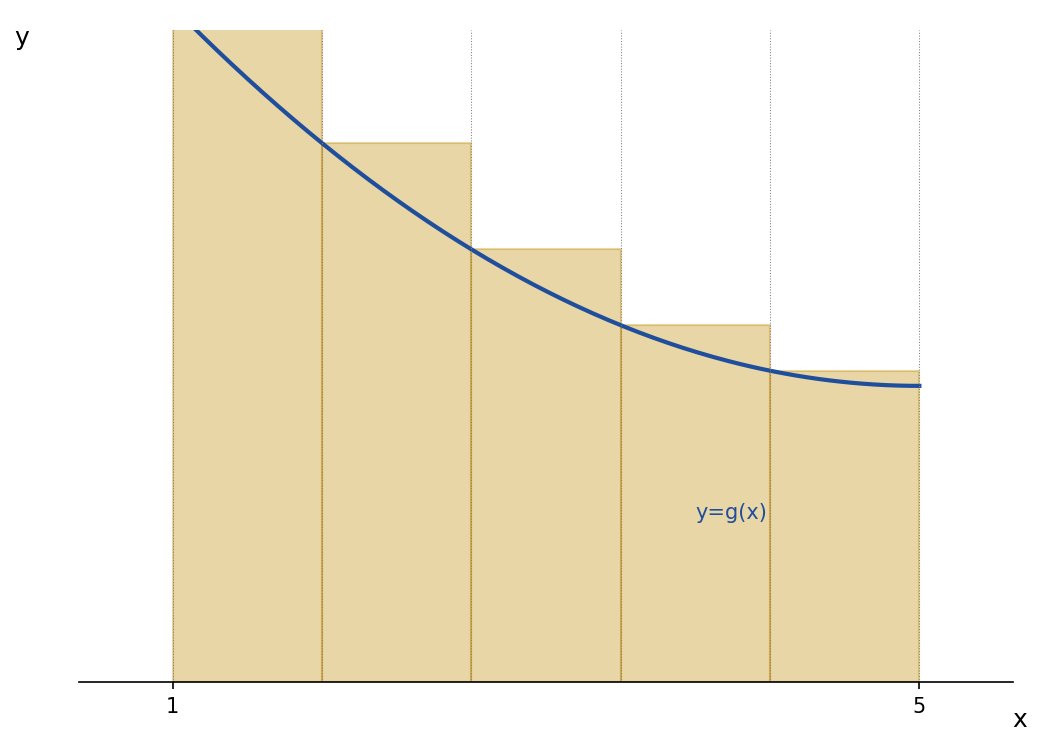
any decreasing function on works, e.g. as sketched above.