 The Learning Cave
Part (a)
1 markNo — a linear model is not likely to fit well.
Explanation: although is close to , indicating a strong linear association, the scatter diagram shows the points bending upward as increases, a curved pattern rather than a straight line. A high value of measures only the strength of a linear relationship; it does not rule out a non-linear model fitting even better, so the curvature visible in the diagram means a straight line is not a good model here.
a linear model is not likely to be a good model for against .
Part (b)(i)
1 markWe compute for each value of in the table and plot it against .
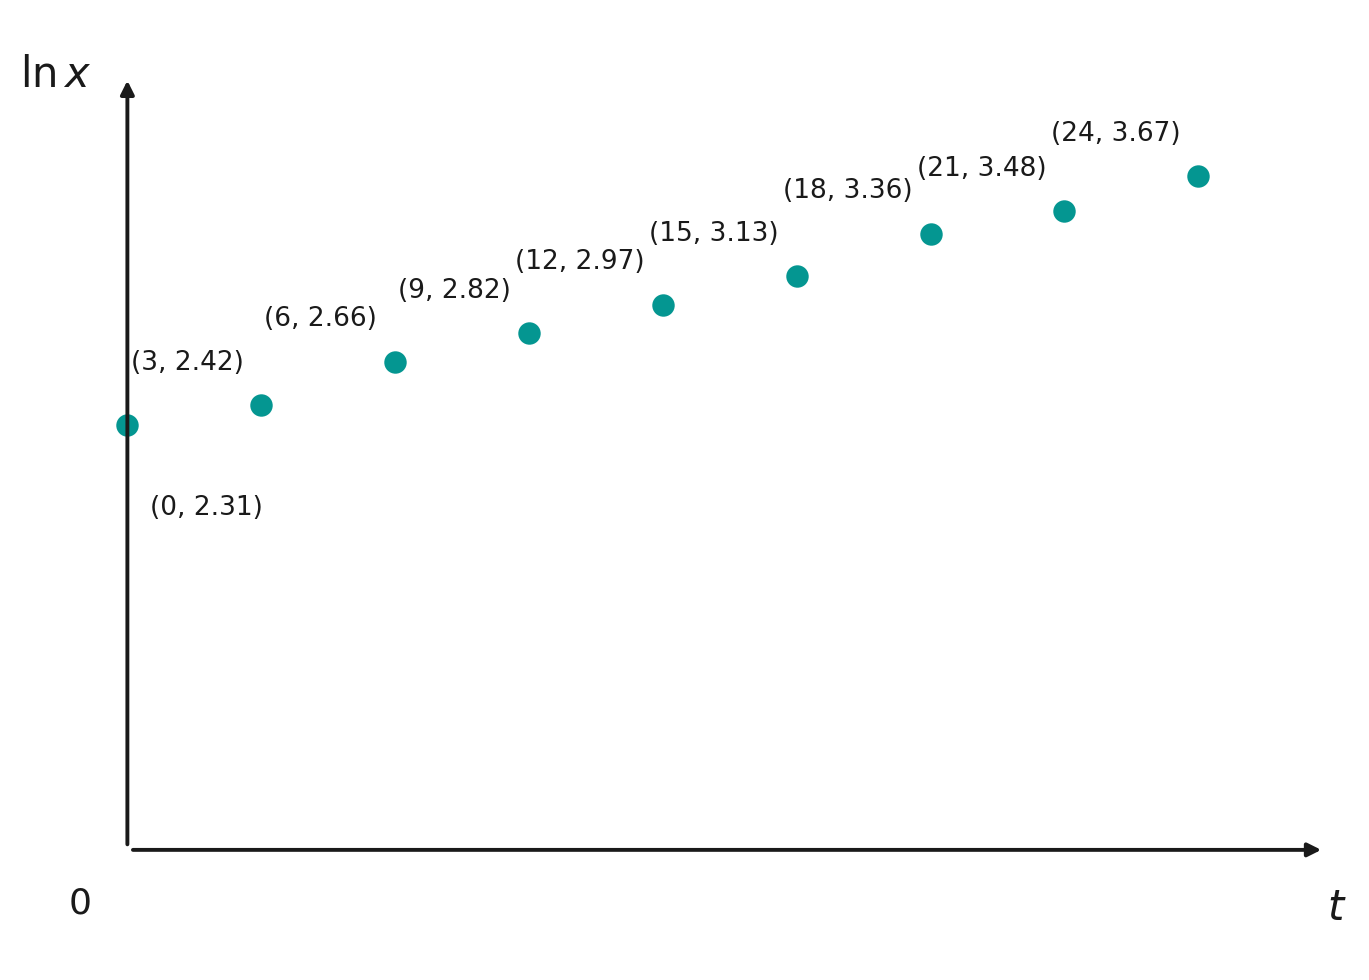
the points now lie close to a straight line with positive gradient, with none of the curvature seen in the original against diagram.
Part (b)(ii)
3 marksBy GC, performing linear regression of on ,
and the product moment correlation coefficient for this model is
| To check your answer: at , , so , close to the given . ✓ |
, , and (3 s.f.).
Part (c)
2 marksThe model has , closer to than the linear model’s , and its scatter diagram in (b)(i) shows the points lying close to a straight line with no visible curvature, unlike the original diagram. Since is equivalent to (an exponential growth model, where ), Toby’s second model fits the data much better than his first, straight-line model for against .
the exponential model , obtained from , is a much better fit than the straight-line model against .