 The Learning Cave
Part (a)(i)
1 markAs increases, increases, but not at a constant rate: rises quickly for small and then more slowly as gets larger, so the rate of increase of decreases as increases.
Part (a)(ii)
6 marksApproach
Both proposed models are linear in a transformed variable ( or ), so we find the product moment correlation coefficient for each transformed scatter plot and take the one closer to as the better fit.
For the model , using the pairs , by GC:
For the model , using the pairs , by GC:
| To check your answer: both correlation coefficients are close to , consistent with the scatter diagram showing a strong relationship; the model’s is markedly closer to , which matches the diagram levelling off much as does. ✓ |
Since for the model is closer to , this model gives the better fit.
, with .
Part (a)(iii)
Using from (a)(ii) with ,
Correct to the nearest 10 cents, cents.
Since lies within the range of the given data (), this estimate is an interpolation, so it is likely to be reliable.
the estimated price is cents, and the estimate is reliable.
Part (b)(i)
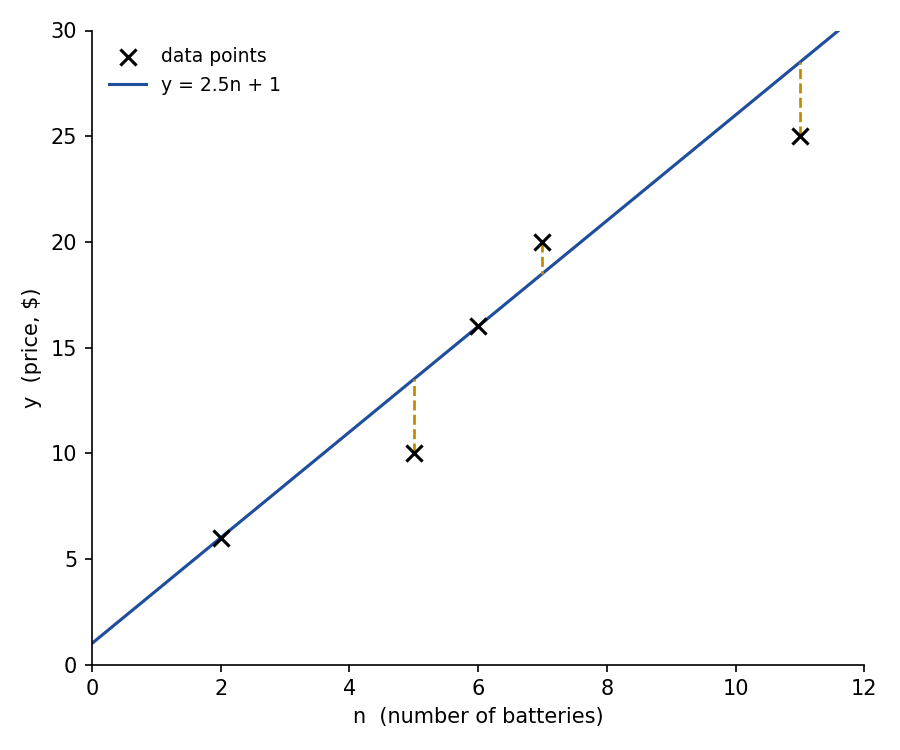
1 markThe line , together with the residual (dashed) for each data point, is:
Part (b)(ii)(A)
1 markThe residual for each point is , where :
| 2 | 5 | 6 | 7 | 11 | |
|---|---|---|---|---|---|
| 6 | 10 | 16 | 20 | 25 | |
| 6 | 13.5 | 16 | 18.5 | 28.5 | |
| residual | 0 | 0 | 1.5 |
These are the dashed vertical segments marked in the sketch in (b)(i).
Part (b)(ii)(B)
1 markResiduals can be positive or negative, so simply summing them could give a small (or even zero) total even when the model fits poorly, because positive and negative residuals cancel each other out. Squaring the residuals before summing removes this cancellation, so the sum reflects the true overall size of the deviations.
Part (b)(ii)(C)
2 marks| To check your answer: the sum of the (unsquared) residuals is , as expected since was not obtained by least squares (a least-squares line always has residuals summing to ). ✓ |
the sum of squares of residuals is .
Part (b)(iii)
A line that fits the data better has a smaller sum of squares of residuals than : the smaller the sum of squares, the better the fit.
Part (b)(iv)
3 marksApproach
All lines share the same slope, so shifting shifts every residual by the same constant. Writing each residual for in terms of the residuals lets us express the whole sum of squares as a single quadratic in , which we then compare against .
Let , the residual when :
| 2 | 5 | 6 | 7 | 11 | |
|---|---|---|---|---|---|
| 1 | 1 | 2.5 |
For general , the residual is , so the sum of squares is
| To check your answer: , matching (b)(ii)(C) exactly, since gives back the original line . ✓ |
We require :
Since the graph of against is an upward parabola, it is negative between its roots.
.